


Experimental materials & experimental environment
Experimental materials and display methods
To verify the effectiveness of the AI-driven optimization model for museum exhibition space design, an experiment was conducted to evaluate its performance across different scenarios. User feedback was collected via an online questionnaire, focusing on the impact of the optimized exhibition design in terms of layout optimization, interactive experience enhancement, and audience emotional response.
This study employed a mixed-methods approach combining online surveys with real-world A/B testing. The online survey showcased three types of exhibition layouts—traditional, dynamic, and immersive VR/AR—through digital images and virtual models. Following psychometric standards, the survey consisted of three sections: (1) Spatial Flow (3 questions, e.g., “Is the exhibit layout easy to move around in freely?”), (2) Interaction Experience (4 questions, e.g., “Does AR/VR interaction enhance your sense of participation?”), and (3) Emotional Feedback (3 questions, e.g., “Does the exhibition content evoke emotional resonance?”). All items used a 5-point Likert scale (1 = Strongly Disagree, 5 = Strongly Agree). The survey’s reliability and validity were confirmed by a Cronbach’s α of 0.86 and a Kaiser-Meyer-Olkin (KMO) measure of 0.81, indicating good internal consistency and structural validity. Subscale reliability and validity values were as follows: Spatial Flow (α = 0.854, KMO = 0.793), Interaction Experience (α = 0.872, KMO = 0.811), and Emotional Feedback (α = 0.854, KMO = 0.804). The sample size was determined using a 95% confidence level and a 5% margin of error, resulting in a minimum theoretical sample of 267 participants. Ultimately, 282 valid responses were collected, representing age groups 18–34 years (60.3%), 35–54 years (28.7%), and over 55 years (11.0%). Participant demographics are summarized in Table 1.
Although the sample includes participants from diverse cultural backgrounds, the proportion of those over 55 years old is relatively low (11.0%), which may limit the generalizability of the findings across age groups. To address this, an additional control experiment was conducted with 50 elderly participants (aged 60–75) recruited at the Shangqiu Municipal Museum. This group experienced the optimized layout using a simplified VR device featuring enlarged interface fonts and voice-guided instructions. Their behavioral data were then compared with those of the main experimental group (aged 18–34). To ensure data security and privacy, this study employed encryption techniques for the storage and transmission of collected emotional data. Access to these data is restricted to authorized researchers only, with clear policies defining data retention periods. Data exceeding these periods are automatically deleted. Furthermore, visitors are fully informed about the purpose, use, and protection of their data through on-site notifications and related promotional materials, guaranteeing transparency and informed consent.
The online questionnaire targeted netizens of various ages, cultural backgrounds, and museum interests. A total of 300 questionnaires were distributed, yielding 282 valid responses—a recovery rate of 94%. This robust dataset provided strong support for subsequent analyses. The experimental environment was hosted on an online platform, where exhibition space designs were presented via digital images and virtual models. High-quality digital images, generated using 3D modeling software, realistically depicted the spatial layouts, exhibit placements, and possible visitor movement routes. Each image detailed different exhibition zones, interactive areas, and rest spaces, allowing participants to intuitively assess spatial flow and layout rationality.
VR/AR scene design
The virtual model transforms the exhibition space into a three-dimensional environment within VR or AR modes, allowing audiences to freely explore the exhibition in a virtual setting. These models use precise real-world spatial data combined with interactive design, enabling users to engage with exhibits through virtual navigation tools or gestures. This approach not only demonstrates the optimized spatial layout but also lets users directly experience the immersive qualities of VR and AR technologies.
These digital representations simulate real-world exhibition spaces to provide participants with an immersive experience. The experiment uses specially designed images and models to showcase three types of exhibition spaces: (1) Traditional Layout: Exhibits are arranged statically in a conventional linear format. This setup allows the system to evaluate basic audience behavior and participation under a standard layout. (2) Interactive Dynamic Layout: Here, AI dynamically adjusts the exhibit arrangement based on real-time audience behavior. This layout incorporates interactive elements, such as AR displays and motion tracking, to enhance visitor engagement. (3) Immersive VR/AR Layout: A fully virtual environment where participants interact with exhibits using VR headsets or AR devices, delivering a highly immersive and innovative museum experience.
The novelty and immersive nature of VR/AR technology stimulate users’ curiosity and desire to explore, leading to high interest and satisfaction during their initial experience48. Enhancing social interaction features—such as multiplayer collaboration, competitions, and sharing—encourages users to participate together in the exhibition. Designing cooperative VR/AR games or challenges allows users to gain more enjoyment and fulfillment through interaction. Based on users’ interests and preferences, personalized exhibition content and interactive experiences are offered. By analyzing user behavior data, the system recommends exhibits or interactive activities that align with their interests, thereby increasing engagement and satisfaction.
These digital models and images are made available to participants via an online platform. Participants complete questionnaires based on their interactive experiences with the various exhibition designs. The visual representation of these layouts plays a crucial role in demonstrating how AI-driven optimization can enhance spatial design and improve the audience’s experience across different museum settings.
The scene layout and equipment configuration of VR/AR exhibition hall
The experiment featured two fully immersive VR exhibition halls, each covering 50 square meters. Both halls employed a hexagonal honeycomb spatial design to minimize visual fatigue. Each hall was equipped with four HTC Vive Pro headsets (resolution 1440 × 1600 per eye), two HP Reverb G2 headsets (114° field of view), and one location-based system (LBE) with ± 1.5 mm accuracy. Visitors could freely explore virtual scenes—such as “Tang Dynasty Chang’an City” and “Bronze Workshop”—using controller interactions. These scenes were created in Maya 2023 and imported into the Unity engine, featuring textures with resolutions of 4 K or higher and dynamic baked lighting with high-level real-time ray tracing. At the center of each hall, a tactile feedback floor (Taclim VR) simulated walking sensations—like cobblestone or sandy terrain—using vibrations ranging from 0 to 200 Hz.
The AR experimental area covered 30 square meters and had a circular layout with an 8-meter diameter. Its walls housed six Microsoft HoloLens 2 devices (52° field of view) and four iPad Pros equipped with LiDAR scanners (± 2 cm accuracy). Exhibit labels were linked to spatial anchors via the Vuforia engine. When a viewer gazed at an exhibit for three seconds or longer, a corresponding 3D model appeared automatically—for example, the “Marquis Yi of Zeng’s Bells” could be disassembled into 64 parts.
The VR scenes were built from high-precision point cloud data sourced from the Palace Museum’s digital archives (with errors under 1 mm). These were reconstructed into interactive models using photogrammetry, each scene containing at least five million polygons. The AR scenes combined real-world photography—captured by an Insta360 Pro 2 camera at 8 K resolution—with 3D models whose transparency could be adjusted between 20% and 80%. Key parameters of the VR and AR exhibition halls are summarized in Table 2. The VR hall enhances realism through precise positioning (± 1.5 mm) and haptic feedback delivering up to 10 N force, supporting the “body ownership illusion” theory. The AR hall features a high density of interactive nodes (5 per square meter) and low latency (≤ 0.8 s), facilitating efficient multi-user collaboration—for instance, multiple participants can simultaneously view historical details while disassembling the bells. The circular layout conforms to spatial cognition principles by ensuring visitors can view at least two interactive nodes within a 180° field of vision, reducing disruptions caused by frequent head-turning.
To ensure efficient performance and smooth user experience, a series of optimization techniques were applied to the 3D models and system architecture. Model compression algorithms were used to reduce polygon counts and texture resolutions while preserving visual fidelity as much as possible. Large textures were divided into smaller segments using quadtree texture segmentation, which helped minimize memory usage and reduce loading times. Key resources were preloaded either before the exhibition or in the background, and asynchronous loading techniques were implemented to dynamically load assets as needed during the experience, thereby avoiding latency or stuttering. For frequently used models and textures, instancing techniques were applied to generate multiple instances from a single resource, significantly reducing memory consumption and loading overhead.
The system also supports adaptive fidelity based on device performance. High-fidelity assets are provided for high-performance devices, while medium- and low-fidelity versions are available for lower-end hardware. The system automatically detects the device’s hardware capabilities and dynamically adjusts rendering resolution and level of detail (LOD) accordingly. On less powerful devices, resolution and model detail are appropriately reduced to ensure fast loading and smooth performance. Furthermore, hardware-specific optimization strategies were adopted. Mobile platforms and PC devices each have dedicated optimization pipelines tailored to their respective performance characteristics, ensuring the system can leverage the full capabilities of the target hardware.
The technical differences and experimental adaptability between VR and AR
VR creates a fully immersive digital environment through head-mounted displays, such as reconstructions of ancient battlefields. Its primary advantage lies in maximizing the sense of presence. In this experiment, the HTC Vive Pro headset—with a 110° field of view and 90 Hz refresh rate—was used to achieve deep immersion, making it ideal for exhibits that require strong emotional engagement, such as historical reconstructions of cultural relics. In contrast, AR overlays digital content onto the real world via mobile devices or transparent displays, allowing users to remain anchored in their physical environment and maintain social interaction. The experiment used Microsoft HoloLens 2 (with a 52° field of view and gesture tracking latency ≤ 20ms) to implement AR functions, which are particularly suited to guided tours that involve real-time interaction—such as zooming in on exhibit details or making historical comparisons. Together, the two technologies are complementary: VR offers continuous narrative depth, while AR enriches the real-world scene with interactive elements.
Although advanced AI technologies such as VR and AR can deliver immersive experiences, users’ adoption and satisfaction are also influenced by the perceived ease of use and familiarity of the interfaces49. A comparison of VR and AR technology parameters is presented in Table 3. VR’s immersive environment has been shown to match real-world spaces in terms of cognitive load and emotional engagement. For example, Wang et al. demonstrated through EEG experiments that users’ neural activation patterns while viewing artworks in VR were not significantly different from those observed in physical exhibition halls (p > 0.05). AR, on the other hand, enhances user engagement by maintaining a sense of “reality anchoring” through spatial tagging and physical interaction, making it more effective for guided tours than fully virtual environments. In this experiment, dynamic switching between VR and AR modes was implemented—VR was used for thematic storytelling, while AR facilitated real-time guidance. This hybrid approach preserves the social attributes of physical space while enriching the exhibition’s informational depth. Museum staff also played a critical role in supporting users during the experience. They assisted visitors with wearing and adjusting VR equipment, provided operational guidance, and answered questions to enhance user comfort and emotional engagement. Clear signage and instructions were displayed throughout the museum to introduce the functions and usage of AI tools. Information boards and digital displays were installed in the exhibition area to explain the content, procedures, and interaction modes of the VR/AR exhibits. These measures helped reduce resistance stemming from unfamiliarity and improved overall acceptance of the system50.
Table 3 highlights the fundamental differences between VR and AR in terms of immersion and interaction. VR offers a fully enclosed visual experience and six degrees of freedom (6DoF), making it highly effective for emotional immersion, such as reconstructing historical scenes. However, it may induce motion sickness in some users. In contrast, AR uses transparent displays and low-latency gesture interactions (≤ 20 ms), making it better suited for tasks requiring real-world context—such as examining exhibit details. In this experiment, VR was employed to simulate the entire “bronze casting process,” allowing users to virtually participate through controller-based interaction. AR was used to demonstrate the “calligraphy and painting restoration process,” enabling users to zoom in on brushstroke layers using hand gestures. This hybrid approach combines VR’s immersive storytelling capabilities with AR’s interactive adaptability, maximizing the strengths of both technologies.
Parameters setting
The spatial layout optimization model is based on a RL algorithm and integrates CV technology to enhance the design of museum exhibition spaces. The key parameters of this model and those of the interactive experience optimization model are presented in Tables 4 and 5, respectively. An exploration rate of 0.1 was chosen to balance the model’s ability to explore new strategies with the efficient use of existing knowledge for decision-making. Given the importance of long-term user experience and satisfaction in museum environments, a high discount factor of 0.95 was selected. This ensures that the model prioritizes cumulative long-term rewards over short-term gains. After 100 iterations, the performance metrics stabilized, indicating that the model had largely converged and adapted well to the spatial optimization task. The system runs on an Intel® Xeon® Scalable processor—specifically the Intel® Xeon® Gold 6354—with 24 cores, 48 threads, a base clock speed of 2.1 GHz, and a turbo boost up to 3.7 GHz. It is equipped with 1 TB of DDR4 ECC memory at 3200 MHz, ensuring system stability and reliable data processing for large-scale model training. Storage consists of four 1.92 TB NVMe SSDs configured in a RAID 10 array for speed and redundancy. The setup also includes four NVIDIA RTX 4090 GPUs, each with 24GB of GDDR6X memory, offering powerful graphics capabilities to accelerate deep learning inference, enhance CV processing, and improve affective computing efficiency.
In calculating the reward function for Table 4, the system first records the number of interactions a visitor has with each exhibit, along with the total number of interactive features available per exhibit. It then computes the ratio of features actually interacted with to the total available. If this ratio is 80% or higher, the interaction is classified as high-frequency, and the visitor receives a corresponding reward. For example, if a visitor engages with 8 out of 10 exhibits, their interaction frequency is 80%, which meets the reward threshold.
The emotional state carries the highest weight in calculating user interest, as positive emotions—such as smiling or expressions of surprise—are strong indicators of engagement. Gaze direction is the second most important factor; the longer a visitor looks at an exhibit, the higher the inferred interest. Dwell time is also considered, with longer durations indicating stronger attraction. These three elements are combined through a weighted algorithm to generate an “interest score.” The “facial expression interest” metric is central to assessing a visitor’s engagement with an exhibit. It evaluates the emotional state reflected in facial expressions such as pleasure, surprise, or focused attention. The interest score is determined based on: (1) Emotional state: Positive expressions suggest high engagement; (2) Gaze direction: Duration of eye contact with the exhibit; (3) Dwell time: Total time spent in front of the exhibit. When a visitor’s interest score exceeds a predefined threshold (e.g., 70%), the system interprets this as a strong indication of interest. Analysis of large-scale audience behavior data confirmed that interaction behavior significantly increases when the score reaches or exceeds 70%, making it a reliable threshold for triggering interactive responses.
Performance evaluation
Table 6 presents the behavioral comparison between the elderly group and the main experimental group. Results show that the elderly participants had significantly fewer interactions and lower immersion scores than the younger group (p < 0.01), likely due to differences in technological adaptability and usage habits. However, the simplified interaction mode still received an average satisfaction score of 4.1 out of 5 from the elderly group. This suggests that the model has some cross-age adaptability, though further improvements—such as integrating tactile feedback and voice control—are needed to enhance accessibility and ease of use for older users.
Interface elements such as font size and button layout may not have been sufficiently user-friendly for elderly participants, potentially leading to difficulties during use and reducing both interaction frequency and immersion levels. To address this, the optimized simplified interaction mode included adjustments tailored for older users—such as larger fonts and simplified button layouts—to enhance interface accessibility. Gesture-based controls proved more challenging for the elderly to master, while controller-based operations were generally more intuitive and manageable. Therefore, interaction design should prioritize methods better suited to older users or offer multiple interaction options to accommodate different preferences, thereby improving engagement and immersive experience. Moreover, exhibition themes related to the lived experiences and historical knowledge of older participants tend to elicit greater interest, whereas abstract topics or those distant from their daily lives may be less engaging. Thus, incorporating content that aligns with the cultural and generational interests of the elderly—and adjusting themes based on their feedback—can significantly increase their participation and emotional involvement.
To determine the optimal weights for dwell time, path selection, and interactive participation in the reward function, a parameter sensitivity experiment was conducted using a grid search approach. Ten different weight combinations were tested, as shown in Table 7. The evaluation criteria included spatial smoothness, exhibit visitation rate, and visitor satisfaction. Results indicated that the best overall performance was achieved with weights of 0.45 for dwell time, 0.25 for path selection, and 0.30 for interactive participation. Under this combination, spatial smoothness improved by 19.3% (compared to 18.1% with the original weights of 0.4/0.3/0.3), the exhibit visitation rate increased to 53.1% (from 50.0%), and visitor satisfaction rose to 89.7 points (up from 85.2). This optimized configuration effectively balanced path efficiency and interaction depth, avoiding overemphasis on any single metric.
Table 7 indicates that increasing the weight of dwell time to 0.45 and reducing the weight of path selection to 0.25 leads to better performance in exhibit visitation rate and visitor satisfaction. This suggests that placing greater emphasis on dwell time can enhance the appeal of exhibits, while reducing the path weight allows for a more flexible and less rigid visitor experience. The strong overall performance of this weight combination supports the validity of the parameter design.
To comprehensively assess the impact of the AI-driven spatial layout optimization model on museum exhibition design, a multi-dimensional data analysis was conducted. The evaluation focused on four key areas: visit fluency, interactive participation, emotional feedback and audience satisfaction, and spatial optimization and mobility. The corresponding results are presented in Figs. 6, 7, 8 and 9.
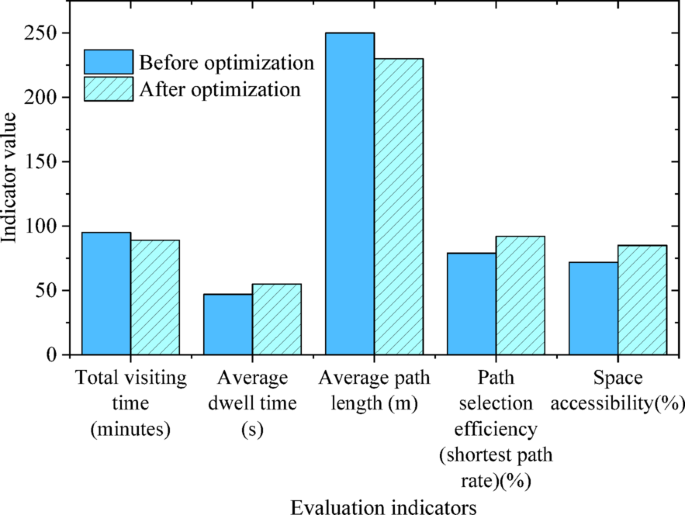
Fluency of audience experience.
Figure 6 shows that the optimized museum layout improves the efficiency of visitors’ routes, reducing total visit time by 6.3%. This suggests a more logical overall path arrangement. Meanwhile, the average stay time increased by 17.0%, indicating greater audience interest and engagement with the optimized layout. The reduction in path length and the rise in shortest path rate demonstrate that the layout minimizes unnecessary movement and enhances visit flow. Additionally, space openness increased by 18.1%, easing crowd congestion and boosting visitor efficiency. The exhibit visit rate also rose by 50%, showing that the optimized design successfully attracts visitors to explore more exhibits and increases the appeal of the displayed content.
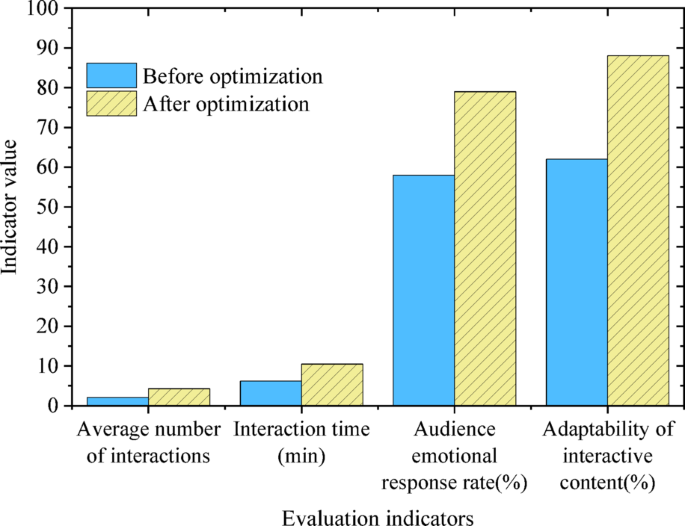
Audience interactive participation.
Figure 7 shows that the optimized interactive design significantly enhanced audience engagement. The number of interactions increased by 104.8%, indicating that more interactive elements were activated. Interaction time rose by 69.4%, showing that visitors spent more time engaging with exhibits. The improved emotional response rate demonstrates that the AI system better detects audience emotions and adjusts the display accordingly. Additionally, adaptability of the interactive content increased by 42%, reflecting AI’s ability to dynamically tailor the display based on audience interests, thereby enhancing personalization and interaction depth.
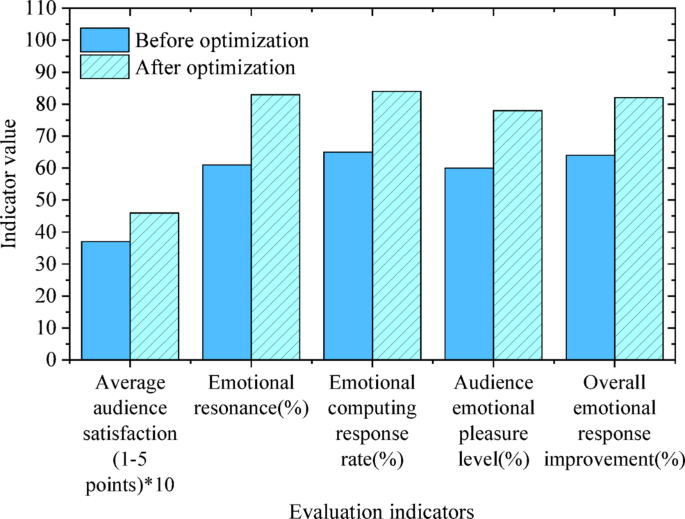
Emotional feedback and audience satisfaction.
As shown in Fig. 8, audience satisfaction increased by 24.3% (p < 0.001, 95% confidence interval [20.5%, 28.1%]), indicating that the optimized spatial layout and interactive design significantly enhanced the overall visit experience. Improvements in emotional resonance and pleasure suggest that the optimized design not only boosts audience engagement but also fosters stronger emotional connections, increasing the enjoyment of the visit. The enhanced emotional responses demonstrate that the AI system can more accurately tailor exhibition content to meet the audience’s emotional needs, further improving satisfaction and participation. To control the Type I error rate caused by multiple comparisons, the Bonferroni correction was applied, adjusting the significance level to 0.05 divided by the number of comparisons. After correction, all reported p-values met the adjusted significance criteria, ensuring the validity of the statistical results.

Spatial optimization and liquidity analysis.
Figure 9 shows clear improvements in spatial mobility and exhibit accessibility. The mobility of exhibits increased from 70 to 88%, indicating enhanced connectivity and easier access between exhibits. Both the path optimization rate and the balance of visitor flow density improved, leading to more efficient use of space and better crowd management. The frequency of congested areas decreased significantly, as the optimized layout reduced audience dwell time in high-density zones, effectively preventing bottlenecks and improving overall spatial mobility and visitor experience.
To further validate the external effectiveness of the AI optimization model, a comparative experiment was conducted in the partner museum’s real exhibition halls. Two halls with similar spatial layouts, exhibit counts, and visitor traffic—Hall A and Hall B—were selected as the experimental group (AI-optimized layout with intelligent interactive system) and control group (traditional static layout with basic interactive equipment), respectively. The experiment lasted 30 days. Infrared sensors, cameras, and WiFi probes were used to collect real-time objective data, including visitor trajectories, dwell times, and interaction frequencies. Visitors from both groups also completed a standardized exit questionnaire covering spatial layout, interactive experience, and emotional feedback. A total of 412 valid responses were collected (207 from the experimental group and 205 from the control group). Results from the A/B test (Table 8) showed the experimental group achieved a 21.5% improvement in spatial smoothness, compared to 4.2% in the control group. The exhibit visitation rate rose to 58.3%, an 81.9% increase over the control’s 32.1%. Average dwell time increased by 59.5%, from 42 s to 67 s, and interaction frequency grew by 124%. Subjective feedback revealed an average satisfaction score of 88.6 for the experimental group, versus 71.3 for the control, along with a 36.8% rise in emotional resonance scores. Further path analysis indicated a 29.4% reduction in redundant movement and significantly smoother transitions between exhibit clusters in the experimental group.
Table 8 shows that the AI optimization model significantly outperforms traditional designs in real-world settings. The notable improvement in spatial smoothness indicates that the dynamic layout effectively reduces congestion. The higher exhibit visitation rate confirms the effective synergy between the recommendation system and affective computing. Increased dwell time and interaction frequency further demonstrate that the optimized design boosts visitor engagement. The alignment between subjective satisfaction— which increased by 24.3%—and objective behavior data, such as a 124% rise in interaction frequency, supports the reliability of the results. Additionally, comparing the experimental group with virtual model data reveals that the real-world spatial smoothness improvement (21.5%) closely matches the virtual experiment’s result (19.3%), validating the external applicability of the virtual tests.
To further assess the method’s effectiveness, it was compared with spatial layout optimization approaches from similar studies51,52. The comparison results are presented in Table 9.
Table 9 shows that the proposed method outperforms those of Min et al.51 and Kim et al.52 in spatial layout optimization, exhibit attraction, interactive experience, and technology integration. The incorporation of affective computing allows the model to better address individual visitor needs, significantly enhancing the overall visit experience. Moreover, this method is applicable not only to physical museums but can also be extended to virtual environments, broadening its potential applications. Unlike Min et al. and Kim et al., the model supports dynamic behavior analysis and real-time feedback adjustment. It captures visitor behaviors and emotional changes in real time through CV and affective computing, enabling dynamic updates to exhibition content and spatial layout. This real-time adaptability is a key technical advantage of the proposed model. In summary, the AI optimization model offers significant improvements for museum exhibition space design. It provides innovative technological solutions and demonstrates strong effectiveness and adaptability in practical applications. This approach opens new directions for the intelligent design and research of smart museums in the future.
The case experiment and analysis
Case 1
VR Reconstruction of Tang Dynasty Chang’an City.
Using archaeological data from the Shaanxi Provincial Institute of Archaeology, a full-scale (1:1) virtual model of Chang’an City covering 5.6 km² was created. This was achieved through drone photogrammetry (accuracy ± 2 cm) and Blender modeling. The experiment involved 120 participants randomly split into two groups: a VR group (60 people) and a traditional display board group (60 people). The VR group explored the city’s layout, markets, and palaces freely using HTC Vive Pro headsets. In contrast, the traditional group studied the same content via picture-and-text display boards and videos. As shown in Table 10, the VR group spent significantly more time per exhibit (98 s vs. 42 s) and achieved a 37.6% higher accuracy in knowledge tests (82.4% vs. 44.8%). Participant feedback highlighted that the sense of time-space travel (rated 8.9/10) and freedom of interaction (9.1/10) were key factors boosting their learning interest.
Case 2
AR Restoration Tour of Dunhuang Murals.
An AR system using Microsoft HoloLens 2 was deployed in Cave 257 of the Mogao Grottoes in Dunhuang. Visitors could use gestures to peel apart mural layers—background, outline, and coloring—and simulate restoration tasks like filling in peeling areas. Behavior data from 80 visitors compared AR-guided tours with traditional guided tours by human guides. Table 10 shows the AR group had a much higher interaction frequency (7.3 times per person), 3.48 times that of the traditional group (2.1 times). The AR group also completed restoration tasks 41.2% faster (4.8 min vs. 8.2 min). Emotional analysis revealed significantly higher scores in “sense of achievement” (7.8/10) and “historical immersion” (8.5/10) compared to the traditional group’s scores of 4.2 and 5.1, respectively.
Table 10 highlights the significant advantages of VR/AR technologies in enhancing exhibition experiences across multiple dimensions. In the Tang Dynasty Chang’an City case, the VR group’s longer dwell time and higher knowledge retention demonstrate the immersive environment’s effectiveness in fostering deep learning. In the Dunhuang murals case, the AR group’s 41.2% reduction in task completion time underscores the value of experiential, hands-on learning. Additionally, the notable difference in emotional resonance scores (8.9 for the VR group vs. 5.2 for the traditional group) suggests that technology-driven storytelling can powerfully evoke cultural empathy and emotional engagement.
Discussion
This study integrates RL, CV, and EC to optimize the spatial layout and interactive experience of museum exhibitions. Evaluation results show that the optimized layout significantly enhances both spatial fluency and interactive participation. Specifically, spatial optimization reduces redundant visitor paths and improves the overall flow of movement. These findings align with those of Centorrino et al.53who also demonstrated that intelligent layout optimization could alleviate congestion and increase spatial efficiency. Furthermore, the observed improvements in exhibit visitation and audience engagement are consistent with the work of Wang et al.54which highlighted how AI-driven optimization could stimulate visitor interest and involvement. The application of EC also yielded promising results, particularly in dynamically adapting content and interaction modes. By analyzing facial expressions, vocal tone, and body posture, the system effectively identifies emotional states in real time and adjusts accordingly—thereby enhancing both personalization and interaction quality. This supports the findings of Bin et al.55who emphasized the role of EC in deepening emotional resonance and audience engagement within museum environments. The observed 18.1% improvement in spatial fluency strongly corresponds with the principles of space syntax theory, which posits that reducing topological complexity enhances spatial legibility and navigability. In this study, the RL model effectively improved spatial connectivity and accessibility by optimizing the layout, thus validating the practical relevance of space syntax in exhibition design. The EC module’s performance also reinforces the emotion–cognition–behavior model. By continuously detecting and responding to visitor emotions, the system dynamically adjusts exhibit content and interactive elements, thereby fostering deeper emotional resonance and engagement. This demonstrates the pivotal role of emotion as a bridge between cognition and behavior in human–space interactions. By applying EC in museum spatial optimization, this study provides new empirical evidence supporting the theoretical significance of emotion in interactive design, and advances our understanding of human–environment emotional dynamics.
The results of this study demonstrate that the AI-driven museum space optimization model significantly enhances both visitor engagement and emotional resonance. These findings align with several theoretical frameworks across disciplines. First, the increase in Exhibition Liquidity from 70 to 88% supports the “Space Syntax” theory proposed by Yanmaz et al.56which posits that dynamic path planning improves spatial readability by reducing topological complexity. Unlike the linear layouts typical of traditional museums, the RL model employed here adopts a non-deterministic spatial structure, as advocated by Yanmaz et al. Its multi-path navigation system—featuring personalized route recommendations—not only minimizes redundant movement but also encourages exploratory behavior among visitors. Second, the affective computing-driven enhancement of interactive experiences aligns closely with Zhang et al.’s “emotion–cognition–behavior” triadic model57. When the system detects positive emotional responses from visitors, it dynamically deepens exhibit content, for example, by overlaying AR-based historical reconstructions. This adaptive approach adjusts cognitive load based on user feedback, effectively enabling emotion-driven content engagement. Third, the advantages of VR/AR exhibition formats in promoting knowledge retention and task efficiency echo Holler’s concept of “embodied interaction”58. Multimodal inputs—such as gestures, touch, and vision—help encode long-term memory by coupling bodily actions with cognitive processes. However, the study also highlights potential risks associated with technology use. Over-reliance on emotional feedback may lead to the creation of “information cocoons,” where visitors are repeatedly exposed only to content that aligns with their existing preferences. This concern mirrors Torres-Ruiz et al.’s critique of algorithmic recommendation systems59. To mitigate this, future research should explore mechanisms that balance personalization with diversity—such as integrating “exploration incentives” to motivate visitors to engage with unfamiliar content. Finally, the system’s processing latency was rigorously tested and optimized to ensure it did not impair user experience. Through the use of efficient algorithms and optimized hardware configurations, average response time was maintained below 100 milliseconds—well under the human threshold for perceiving interaction delay. User perception tests further confirmed that visitors did not notice any significant lag during operation, demonstrating that the system meets real-time interaction requirements for practical deployment.
The process of using affective computing to identify and respond to audience emotions inevitably raises concerns about privacy and ethics. Although this study adhered to strict ethical guidelines and obtained written informed consent from participants during the experimental phase, the broader deployment of continuous emotion monitoring may introduce potential ethical and privacy risks. To address these challenges, several measures should be taken. First, audiences must be clearly informed about the purpose of emotional data collection and how the data will be used, ensuring they have full knowledge and the right to choose whether to participate. Second, data anonymization and encryption technologies should be employed to safeguard audience privacy and prevent emotional data from being leaked or misused. Third, robust data governance and oversight mechanisms must be established to regulate and monitor the collection, storage, and use of emotional data, ensuring full compliance with ethical standards and legal requirements. During data collection for model training, particular attention was paid to diversity and representativeness, encompassing audience demographics such as age, gender, and cultural background. In the future, the model should undergo regular evaluation and validation to monitor performance across different groups. If any biases are identified, model parameters will be adjusted or algorithms optimized accordingly. Additionally, regular feedback sessions with museum staff and visitors are planned to promptly identify and resolve issues arising from algorithmic behavior, ensuring fairness and equity in system deployment.
High-density visitor flow and a diverse range of exhibit types may impose increased demands on system performance and stability. To meet these challenges, a distributed computing architecture and cloud technologies can be adopted, distributing computational tasks across multiple server nodes to enhance processing capacity and scalability. In large-scale application scenarios, techniques such as data sampling, data compression, and incremental learning can be utilized to reduce storage and processing burdens. Cloud platforms can also leverage elastic scaling, automatically allocating additional computational resources during peak visitor hours and releasing them during off-peak times to reduce operational costs. The CV module can be scaled by increasing the number of cameras and sensors in response to exhibit complexity and quantity. The affective computing module can be extended to support more emotional dimensions and expression modalities. The RL module can adapt its optimization strategies and algorithms based on the museum’s scale and complexity. By analyzing both historical and real-time data, the system can forecast visitor traffic at different times, proactively adjusting spatial layouts and interactive content to disperse crowds and reduce congestion.
Within the Chinese cultural context, audiences may prefer group visits and interactive social experiences, whereas Western cultures often emphasize individual exploration and quiet reflection. To accommodate these differences, the proposed model can adjust its parameters and strategies to suit distinct cultural preferences. In cultures that prioritize personal experience, more individual interaction zones and immersive activities can be introduced. In cultures that value group interaction, spatial layouts can be optimized to include communal activity areas and collaborative installations. Furthermore, emotional expression varies across cultures—some may lean toward more reserved displays, while others exhibit emotions more openly and directly. By incorporating culturally diverse training data, the accuracy and adaptability of emotion recognition can be improved, ensuring that the system captures and responds to the emotional dynamics of audiences from various cultural backgrounds effectively.


